Installing Python Packages from a Jupyter Notebook

In software, it's said that all abstractions are leaky, and this is true for the Jupyter notebook as it is for any other software. I most often see this manifest itself with the following issue:

I installed package X and now I can't import it in the notebook. Help!

This issue is a perrennial source of StackOverflow questions (e.g. this, that, here, there, another, this one, that one, and this... etc.).

Fundamentally the problem is usually rooted in the fact that the Jupyter kernels are disconnected from Jupyter's shell; in other words, the installer points to a different Python version than is being used in the notebook. In the simplest contexts this issue does not arise, but when it does, debugging the problem requires knowledge of the intricacies of the operating system, the intricacies of Python package installation, and the intricacies of Jupyter itself. In other words, the Jupyter notebook, like all abstractions, is leaky.

In the wake of several discussions on this topic with colleagues, some online (exhibit A, exhibit B) and some off, I decided to treat this issue in depth here. This post will address a couple things:

  • First, I'll provide a quick, bare-bones answer to the general question, how can I install a Python package so it works with my jupyter notebook, using pip and/or conda?.

  • Second, I'll dive into some of the background of exactly what the Jupyter notebook abstraction is doing, how it interacts with the complexities of the operating system, and how you can think about where the "leaks" are, and thus better understand what's happening when things stop working.

  • Third, I'll talk about some ideas the community might consider to help smooth-over these issues, including some changes that the Jupyter, Pip, and Conda developers might consider to ease the cognitive load on users.

This post will focus on two approaches to installing Python packages: pip and conda. Other package managers exist (including platform-specific tools like yum, apt, homebrew, etc., as well as cross-platform tools like enstaller), but I'm less familiar with them and won't be remarking on them further.
Exploring Line Lengths in Python Packages

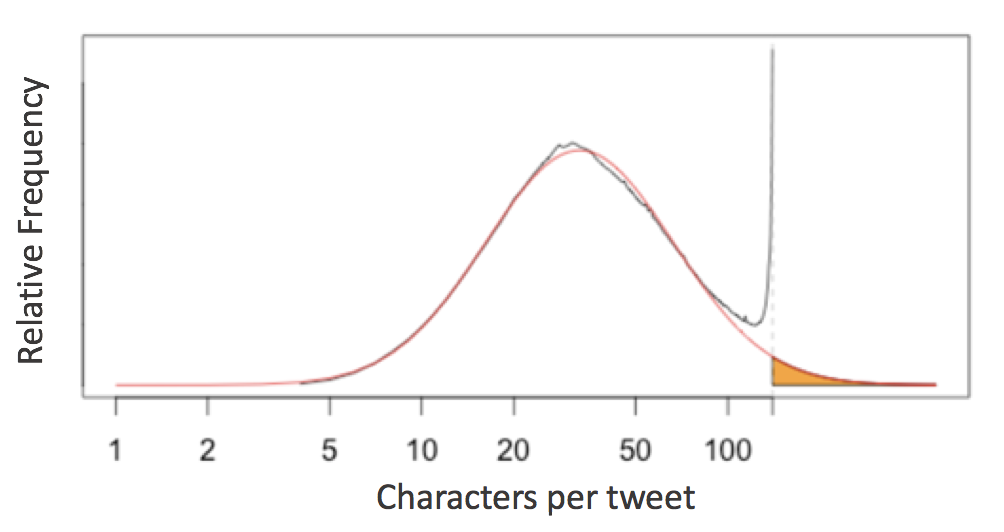
This week, Twitter upped their single-tweet character limit from 140 to 280, purportedly based on this interesting analysis of tweet lengths published on Twitter's engineering blog. The gist of the analysis is this: English language tweets display a roughly log-normal distribution of character counts, except near the 140-character limit, at which the distribution spikes:

The analysis takes this as evidence that twitter users often "cram" their longer thoughts into the 140 character limit, and suggest that a 280-character limit would more naturally accommodate the distribution of people's desired tweet lengths.

This immediately brought to mind another character limit that many Python programmers face in their day-to-day lives: the 79-character line limit suggested by Python's PEP8 style guide:

Limit all lines to a maximum of 79 characters.

I began to wonder whether popular Python packages (e.g. NumPy, SciPy, Pandas, Scikit-Learn, Matplotlib, AstroPy) display anything similar to what is seen in the distribution of tweet lengths.

Spoiler alert: they do! And the details of the distribution reveal some insights into the programming habits and stylistic conventions of the communities who write them.

Group-by From Scratch

I've found one of the best ways to grow in my scientific coding is to spend time comparing the efficiency of various approaches to implementing particular algorithms that I find useful, in order to build an intuition of the performance of the building blocks of the scientific Python ecosystem.

In this vein, today I want to take a look at an operation that is in many ways fundamental to data-driven exploration: the group-by, otherwise known as the split-apply-combine pattern. An architypical example of a summation group-by is shown in this figure, borrowed from the Aggregation and Grouping section of the Python Data Science Handbook:

Triple Pendulum CHAOS!

Earlier this week a tweet made the rounds which features a video that nicely demonstrates chaotic dynamical systems in action:

Edit: a reader pointed out that the original creator of this animation posted it on reddit in 2016.

Naturally, I immediately wondered whether I could reproduce this simlulation in Python. This post is the result.

Reproducible Data Analysis in Jupyter

Jupyter notebooks provide a useful environment for interactive exploration of data. A common question I get, though, is how you can progress from this nonlinear, interactive, trial-and-error style of exploration to a more linear and reproducible analysis based on organized, packaged, and tested code. This series of videos presents a case study in how I personally approach reproducible data analysis within the Jupyter notebook.

Each video is approximately 5-8 minutes; the videos are available in a YouTube Playlist. Alternatively, below you can find the videos with some description and links to relevant resources